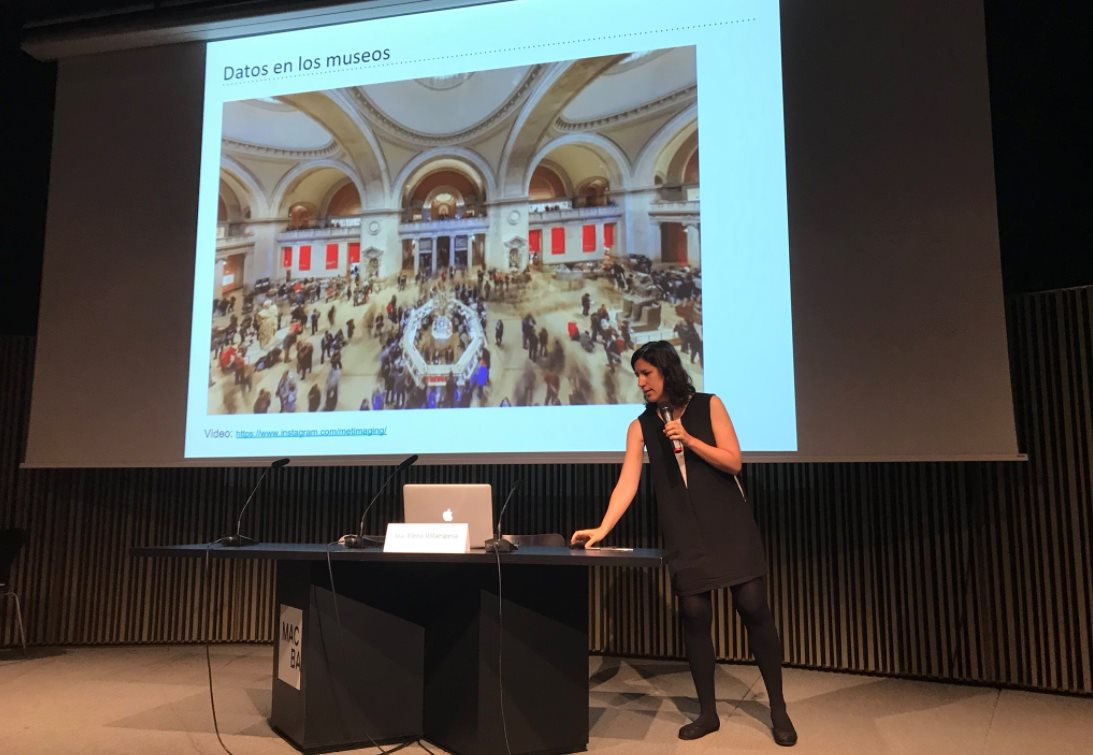
Elena Villaespesa
A conference entitled ‘Knowing the virtual publics of the museums’, organized by the Observatory of Audiences-Cultural Heritage of Catalonia, took place last October in the MACBA (Museum of Contemporary Art of Barcelona). I was lucky enough to participate as a speaker and to take advantage to briefly see the charms of Barcelona. My talk was focused on the creation of a culture of data in a museum. Based on my experience in the Tate in London and in the Metropolitan Museum of New York, where I worked as a digital analyst, I shared the steps and activities that I had carried out for the establishment of a digital analytics program and a culture of data.
The change in an organization focused on the use of data, where the user information takes on an important weight in the decision-making, doesn’t occur overnight. It is an evolution of various areas within the process of collecting, analyzing, communicating and using the data:

Audit
The first step consists of the carrying out of an analysis of the systems available to the museum for digital analytics, as well as an audit of the configuration of the tools and the quality of the data collected.
Evaluation requirements
The starting point should always be the digital strategy or the museum strategy to define the indicators and from this point on, to define which data need to be analysed. Furthermore, as part of this exercise it is fundamental to make a list of the goals of the evaluation and the needs for studies of audiences. To do so, it is key to have the collaboration and communication with all people that carry out digital activities either within the digital department or outside it.
Data strategy
The next step is the definition of a data strategy. This document should include what the goals are in terms of collecting and using data. For example, the results of the data analysis can be used for:
- getting to know the users
- creating segments
- personalizing the experience
- optimizing our digital offer
- increasing the revenues
- measuring the results of distinct marketing campaigns
- showing the impact of our activities
- informing about the strategy
This document should be accompanied by an implementation plan of the digital analytics where the specific tasks to be carried out, are defined along with a timing.
Indicators
This is one of the most complicated phases and one that requires special work of interaction and collaboration to select the list of key indicators (KPIs – Key Performance Indicators) that serve to evaluate the success of our digital activities. For example, in the Met I created a first draft of a dashboard with the indicators that we could potentially use. Based on this initial proposal, the team from the digital department made comments about which ones were more useful, which others could be added or where we would need a greater or lesser breakdown of the results.
Tools and methodologies
Depending on the goals of the digital activity and the indicators selected, we would need to choose certain methodologies and tools or other ones.
Some tools provide us with quantitative information, and others qualitative. Furthermore, as the NNGroup classifies distinct methods of analysis of users, we can find those based on user intentions and others which collect data about their behaviour. In this step it is important to have the correct configuration of the tools to obtain the desired data. For example, in the case of Google Analytics we would need to create distinct views, add filters of configure events or conversion goals.

Communication
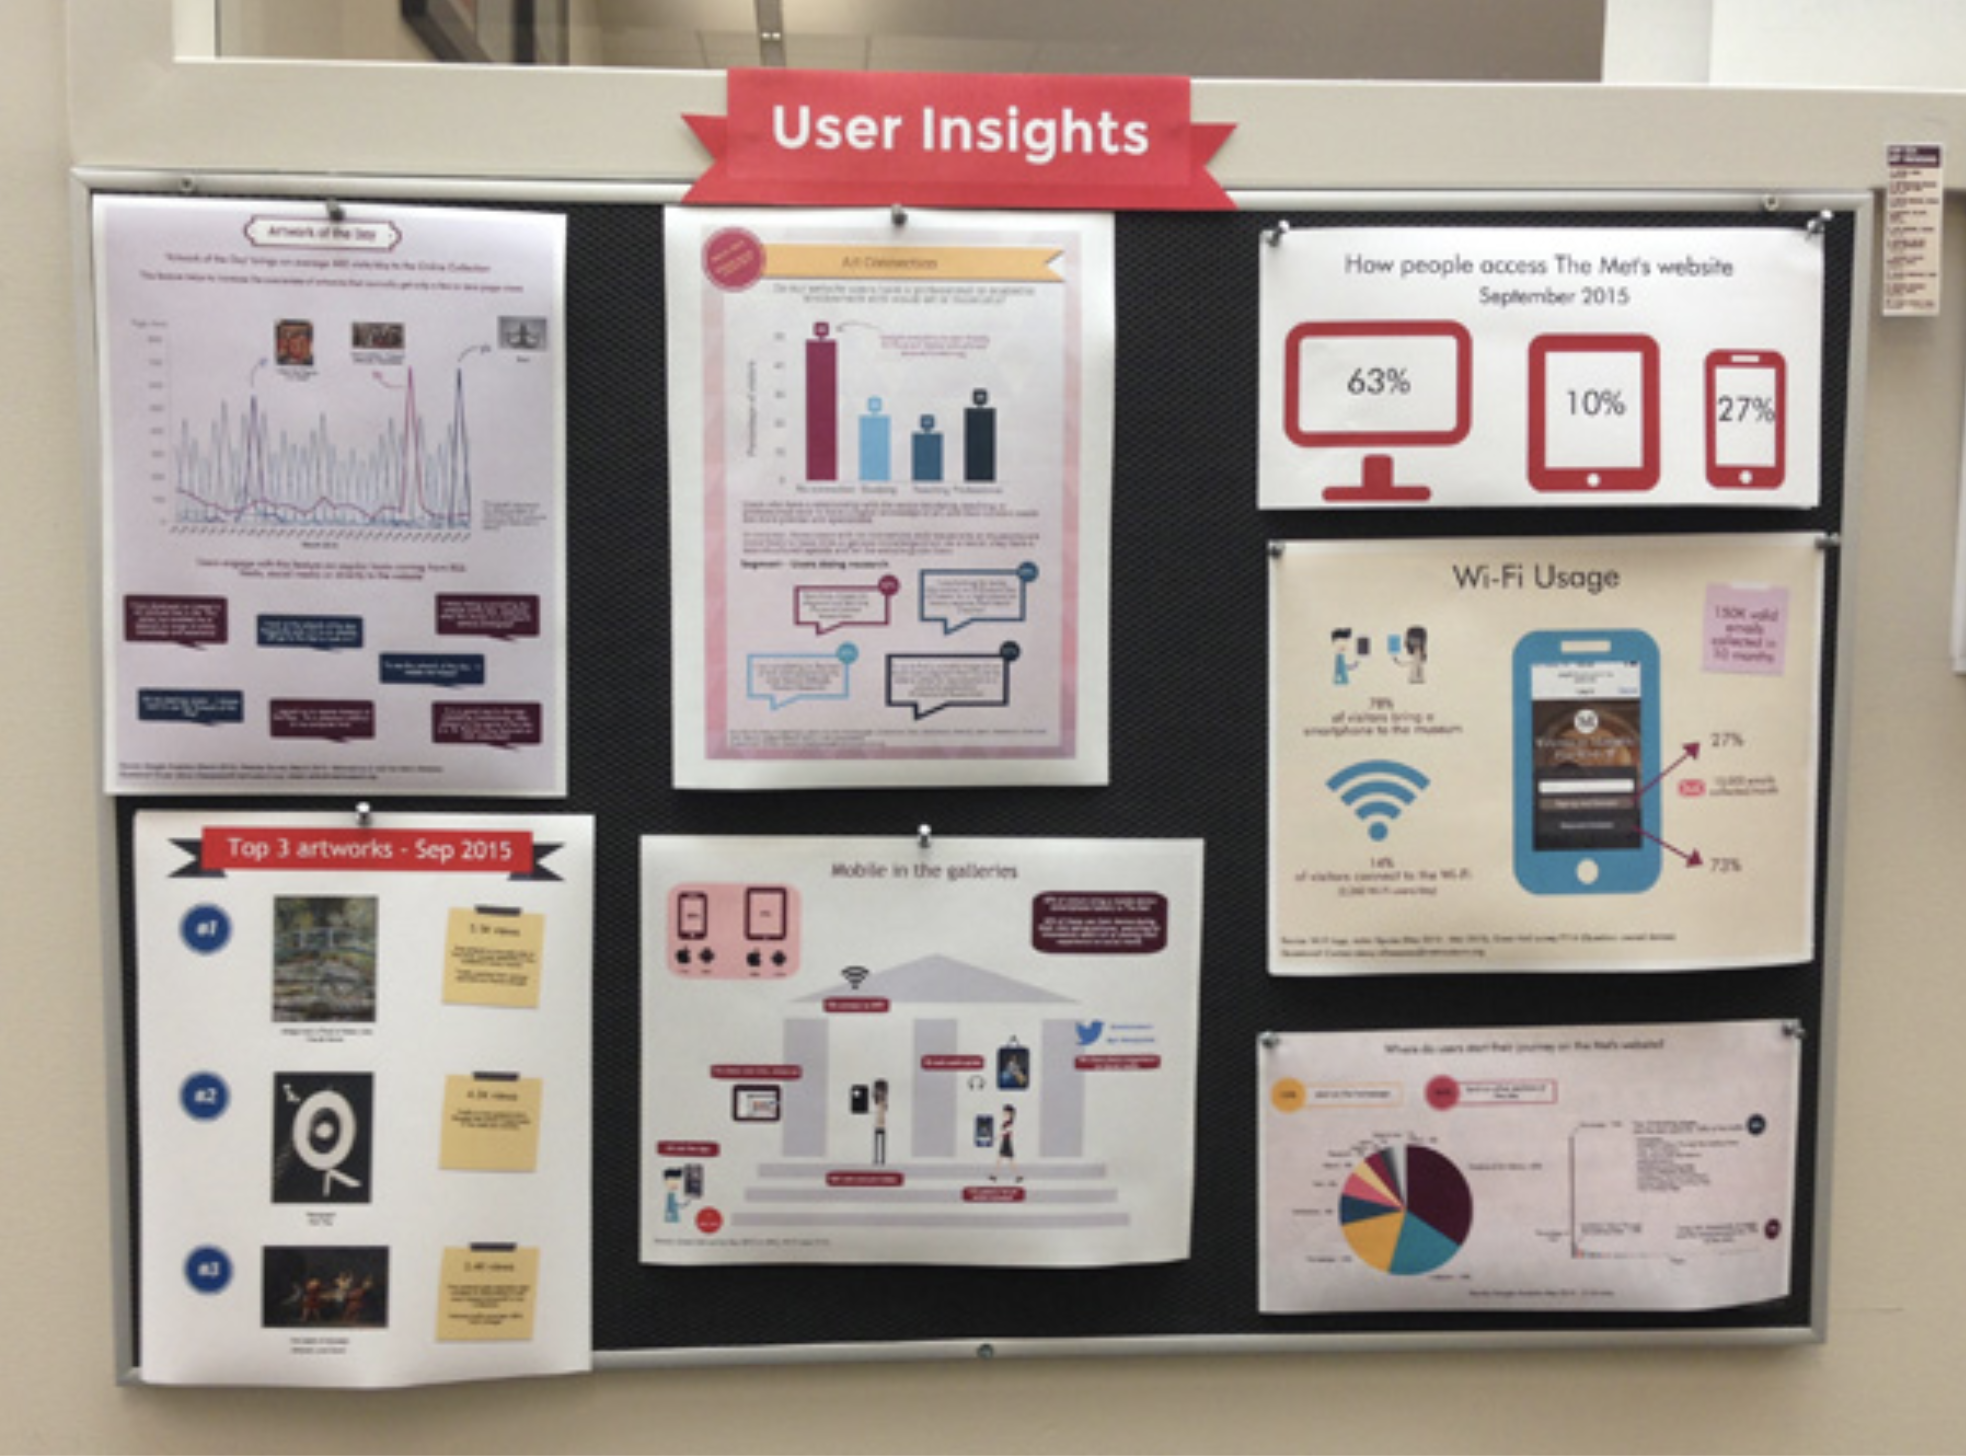
As a digital analyst, one of my favourite parts in the work has always been when I have new data to analyse. But this function of obtaining results is just as important as communicating them within the museum. To do so, I have used different tools, from centralized dashboards and reports distributed by mail, to infographics hung next to the microwave in the department’s kitchen.
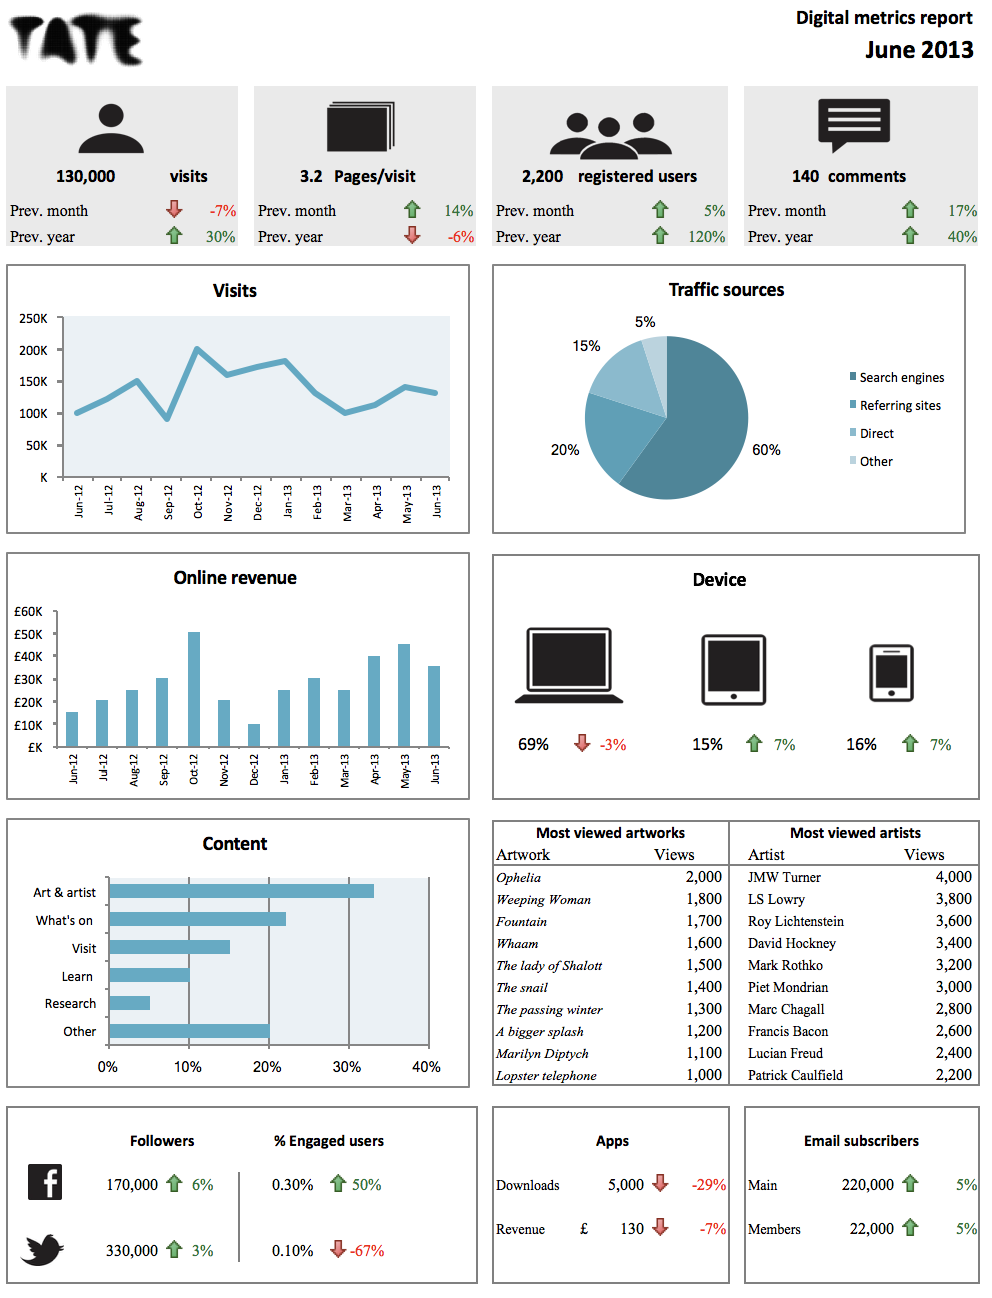
In the Tate, for example, I began with a simple dashboard that included the key indicators of the web, social media, mobile apps and email. The distribution of this dashboard not only helped to analyse trends in these digital services but also showed the quantity of data available to staff who didn’t know about digital analysis. Similar to the experience in the Tate, in the Met I also created a dashboard in collaboration with other people from the digital department. I also use other means to distribute information such as a noticeboard with visualizations, presentations in meetings, a digital screen with various rotating reports, or a channel in Slack.
Towards a culture of data
This change towards an organizational culture in the use of data is slow and requires work in the areas mentioned in a continuous way. It is also key to turn it into a priority by the leadership of the museum. In the Tate this work culture is reflected in the digital strategy:
“Understanding our audiences and evaluating the impact and value of their digital experiences is a vital element of Tate’s digital transformation. One of the aims is to establish a digital culture within Tate that is audience centred, responds to the audience needs and that is also iterative and evaluation led”.
The same happened in the Met where we established some processes and good practices in the use of digital analysis.
Recommended links
Finding the motivation behind a click: Definition and implementation of a website audience segmentation, Elena Villaespesa and John Stack, Museums and the Web 2015
Getting the art to our users: A user-centred approach to navigate Tate’s digital content, Emily Fildes and Elena Villaespesa, Arts Management Newsletter, 2014
How to evaluate success online?, Let’s Get Real, Culture 24, 2014
What Can We Learn from Our Users? Visitor Feedback and Social Media, MCN 2013, video 1h 20min